I wanted to be able to show my on-air status on this website and on my QRZ.com page, so set about figuring out how to do this.
It appeared that Node-RED was a suitable piece of software to give me a two-way access to the radio, so I had a play on my dev PC. Once I saw how it worked, I moved over to using a Raspberry Pi 5 as I had one doing nothing.
The first thing I did was configure a permament symlink to the IC-7300 USB as it seemed to switch between being USB0 and USB1, so now I can just use /dev/IC7300.
I installed rigctl on the Pi, along with Node-RED. I set the rigctl to communicate over the new USB link. This now gave me multiple options moving forward, as I can use rigctl to send and receive from multiple apps if I need.
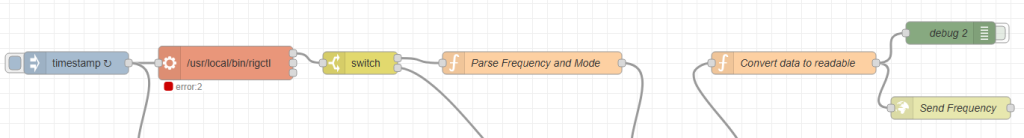
I created a simple rerquest to the radio to get the frequency and mode, and upload the results to this website. I'm using WP-Options to store the data. If the rig doesn't respond, I set the status as Offline, and limit the loop speed to reduce load while the rig is off.
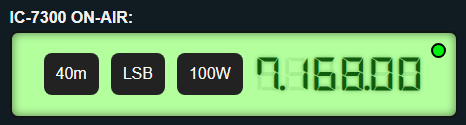
I created a simple front-end dashboard to make the display look nice. Not like the IC-7300, but more like an older style radium-green LCD look:
I added the power output shortly after creating the display, so the expanded flow changed:
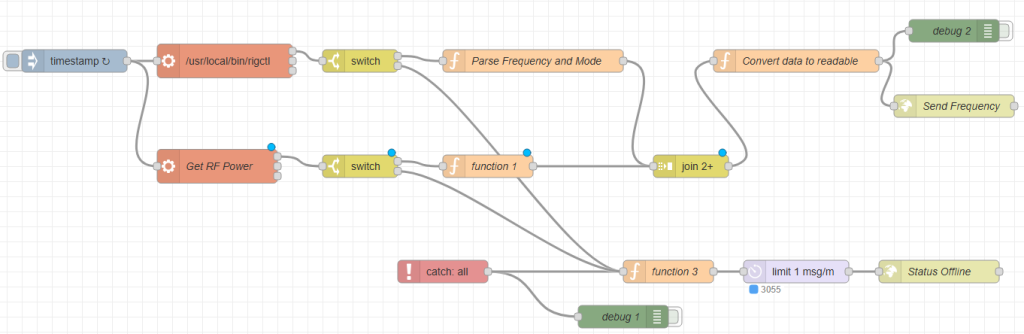
I get the raw data, add in the band from the frequency, merge the power in and handle errors/offline.
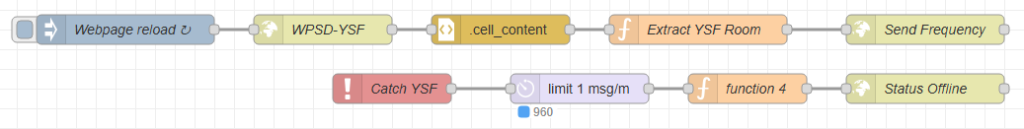
I then thought, why not do the same sort of thing with my digital hotspots? Just because!
This was an interesting one, and is probably handled really badly. But on the front end of my website and QRZ.com, I show the room/reflector I am connected to currently, for YSF and D-Star.
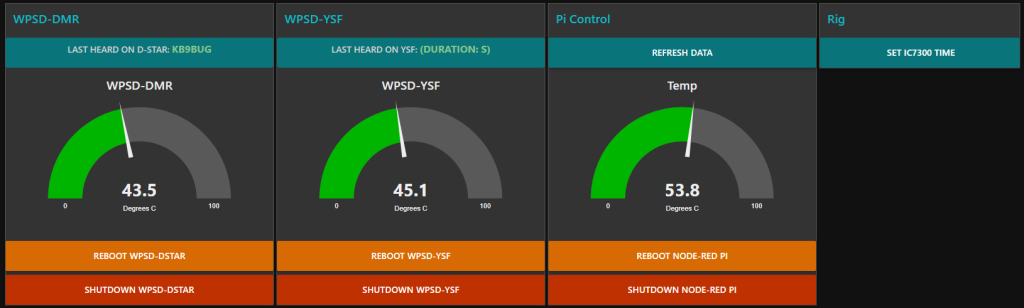
On the back end, I have a Node-RED dashboard to handle who was last seen (clickable to QRZ.com) and a few other elements, such as rebooting/shutting down the Pi hotspots, showing the temperatures, and most recently, a button to set the date and time on my IC-7300, because, if you own one, you know they are well known for not keeping the time!
I'm sure I'll build out the dashboard to do more useful things!